LNP CHARACTERISATION
Analyse Lipid Nanoparticles with Single‑Particle Precision
Move beyond ensemble averages. Measure LNP size, concentration and zeta potential particle by particle to reveal subpopulations and formulation changes.
Spot aggregation early
Monitor formulation stability and detect small aggregate populations at low levels.
Single-particle zeta potential
Compare surface charge across formulations, measured alongside size and concentration.
Standardise LNP analysis
NIST-traceable calibration for results comparable across users and sites.
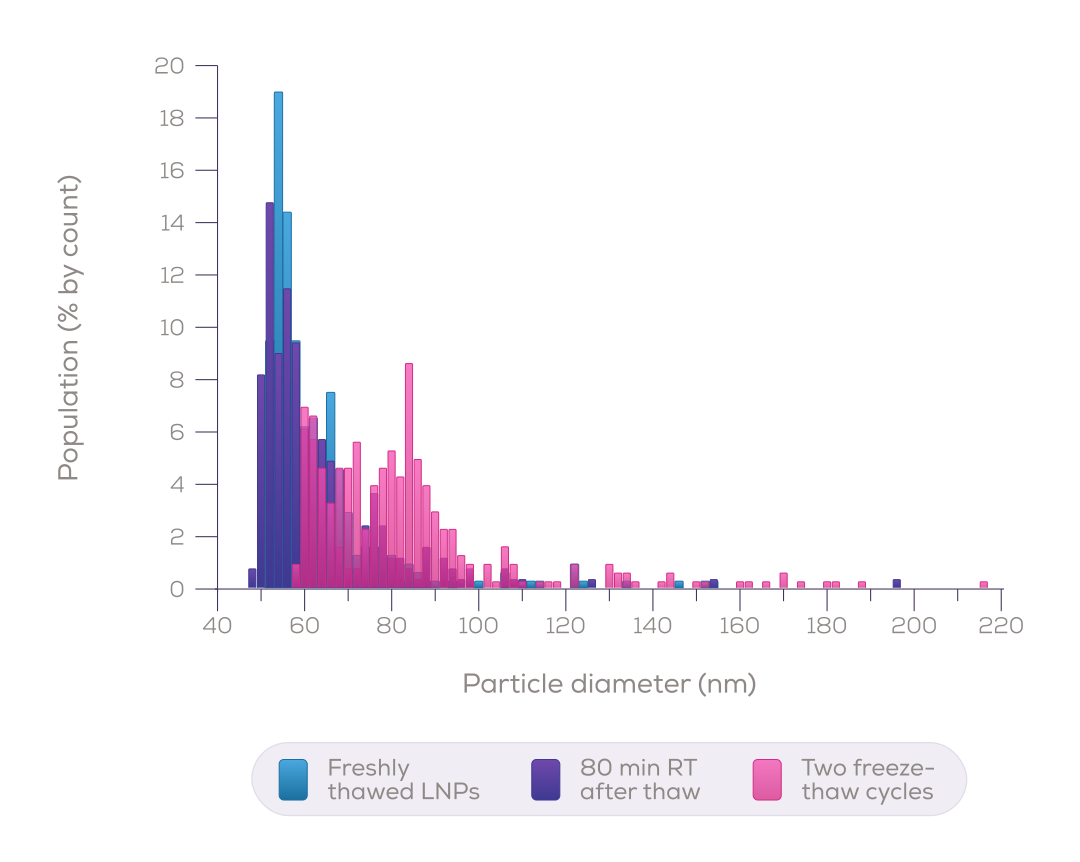
Spot freeze-thaw aggregation, particle by particle
Counting LNPs one at a time on the Pulsoid shows how a formulation holds up after thawing. Freshly thawed LNPs and those left 80 minutes at room temperature share one population near 55 nm. After two freeze-thaw cycles, a distinct population of larger particles appears near 85 nm.
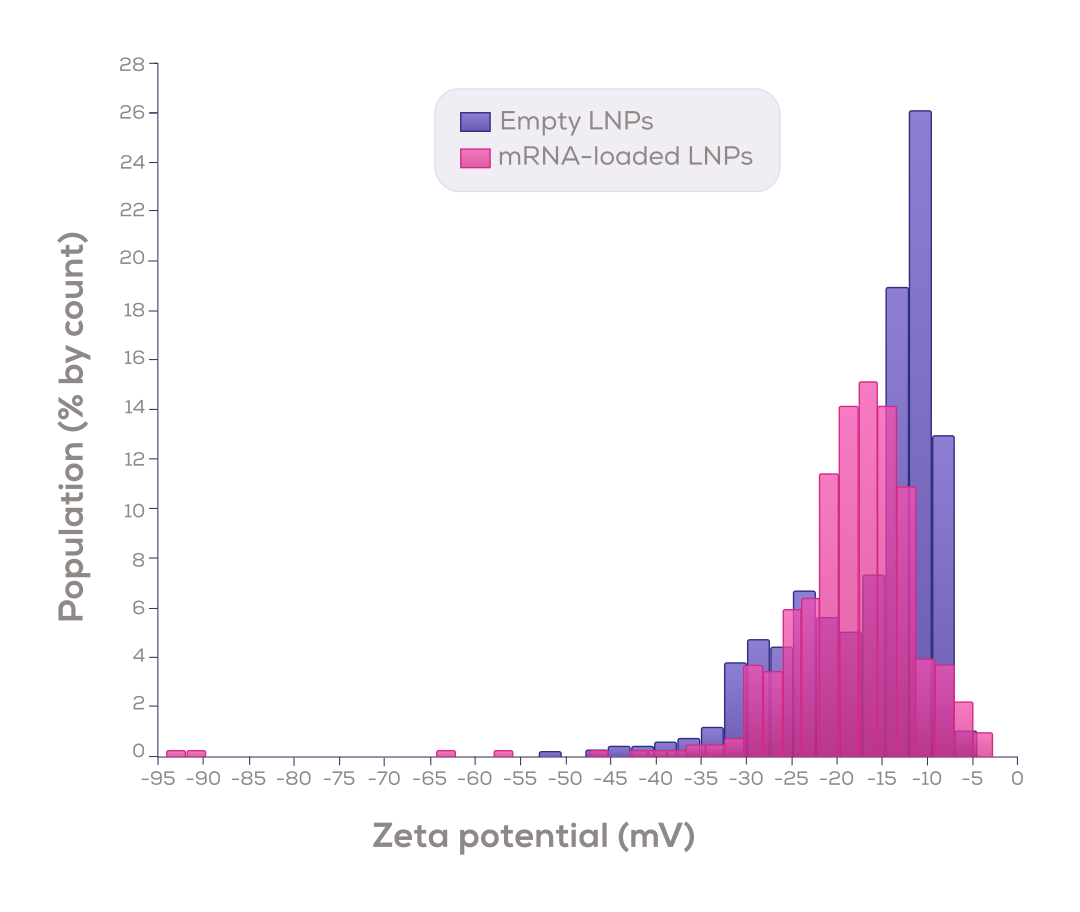
Compare surface charge across formulations
Measure zeta potential particle by particle to see how cargo loading changes surface charge, as in this comparison of empty and mRNA-loaded LNPs.
Resolve what light scattering blurs together
In a published comparison, one four-population bead mixture was measured by tunable resistive pulse sensing (TRPS), NTA and multi-angle DLS. TRPS resolved all four sizes. NTA returned one broad envelope, and MADLS a single mode¹.
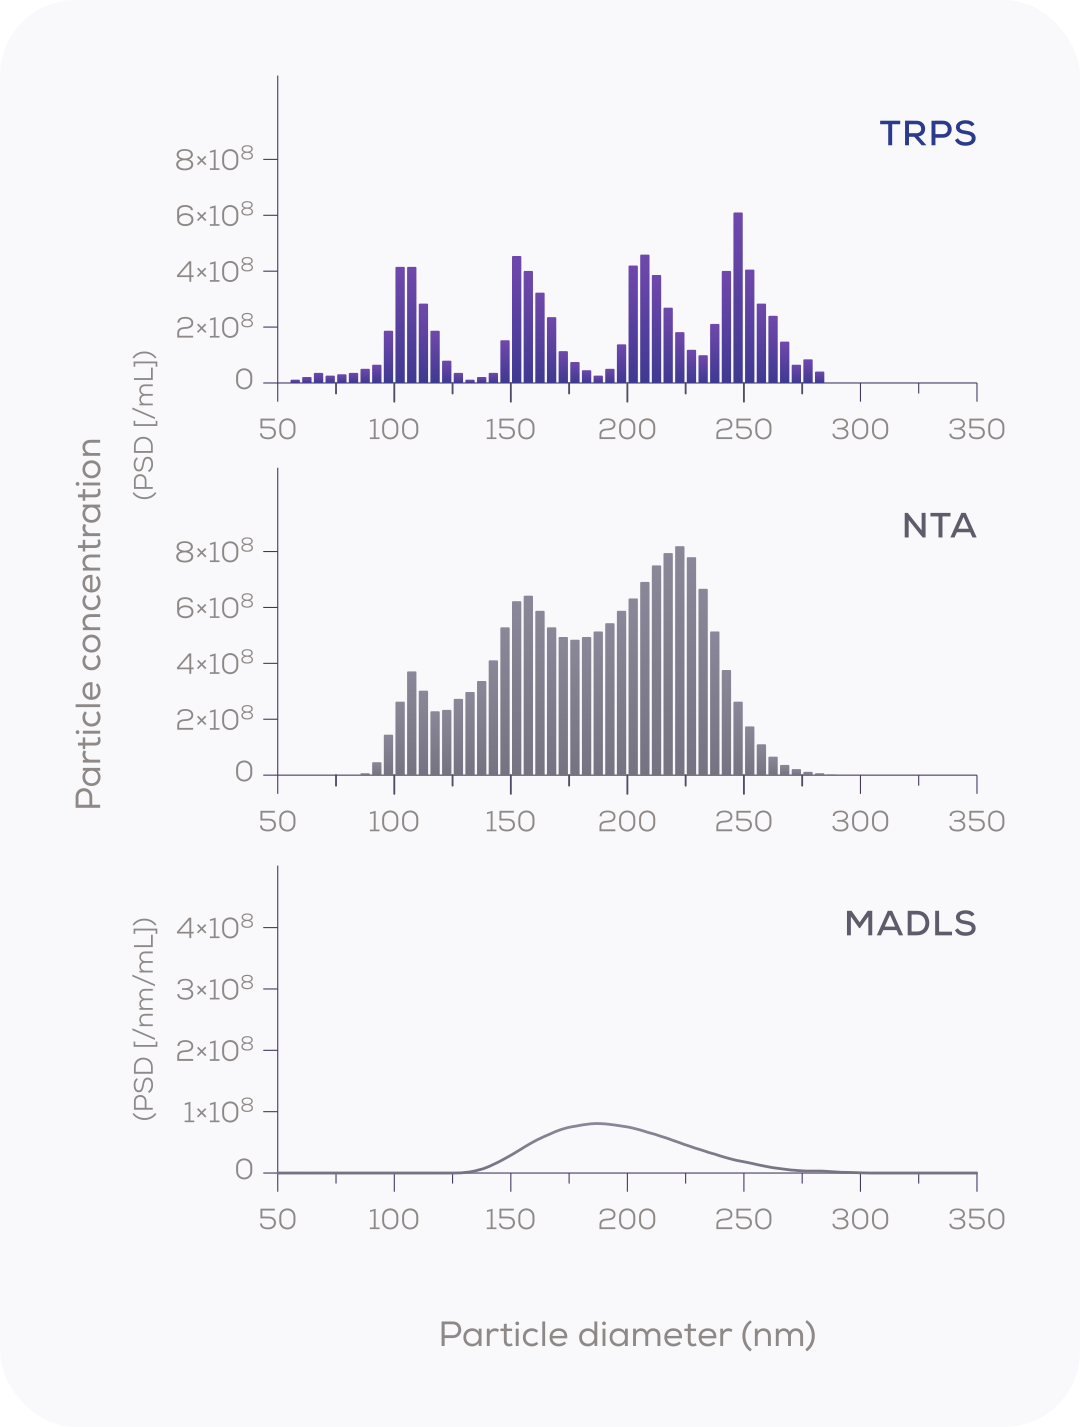
Nanopore sensing vs light-based sizing
Size resolution: the ability to separate particle populations of similar size.
¹ Vogel R. et al. (2021) J Extracell Vesicles 10(3):e12052, Fig. 3. Reproduced under CC BY 4.0. Measured by TRPS.
Choose the right tool for your workflow
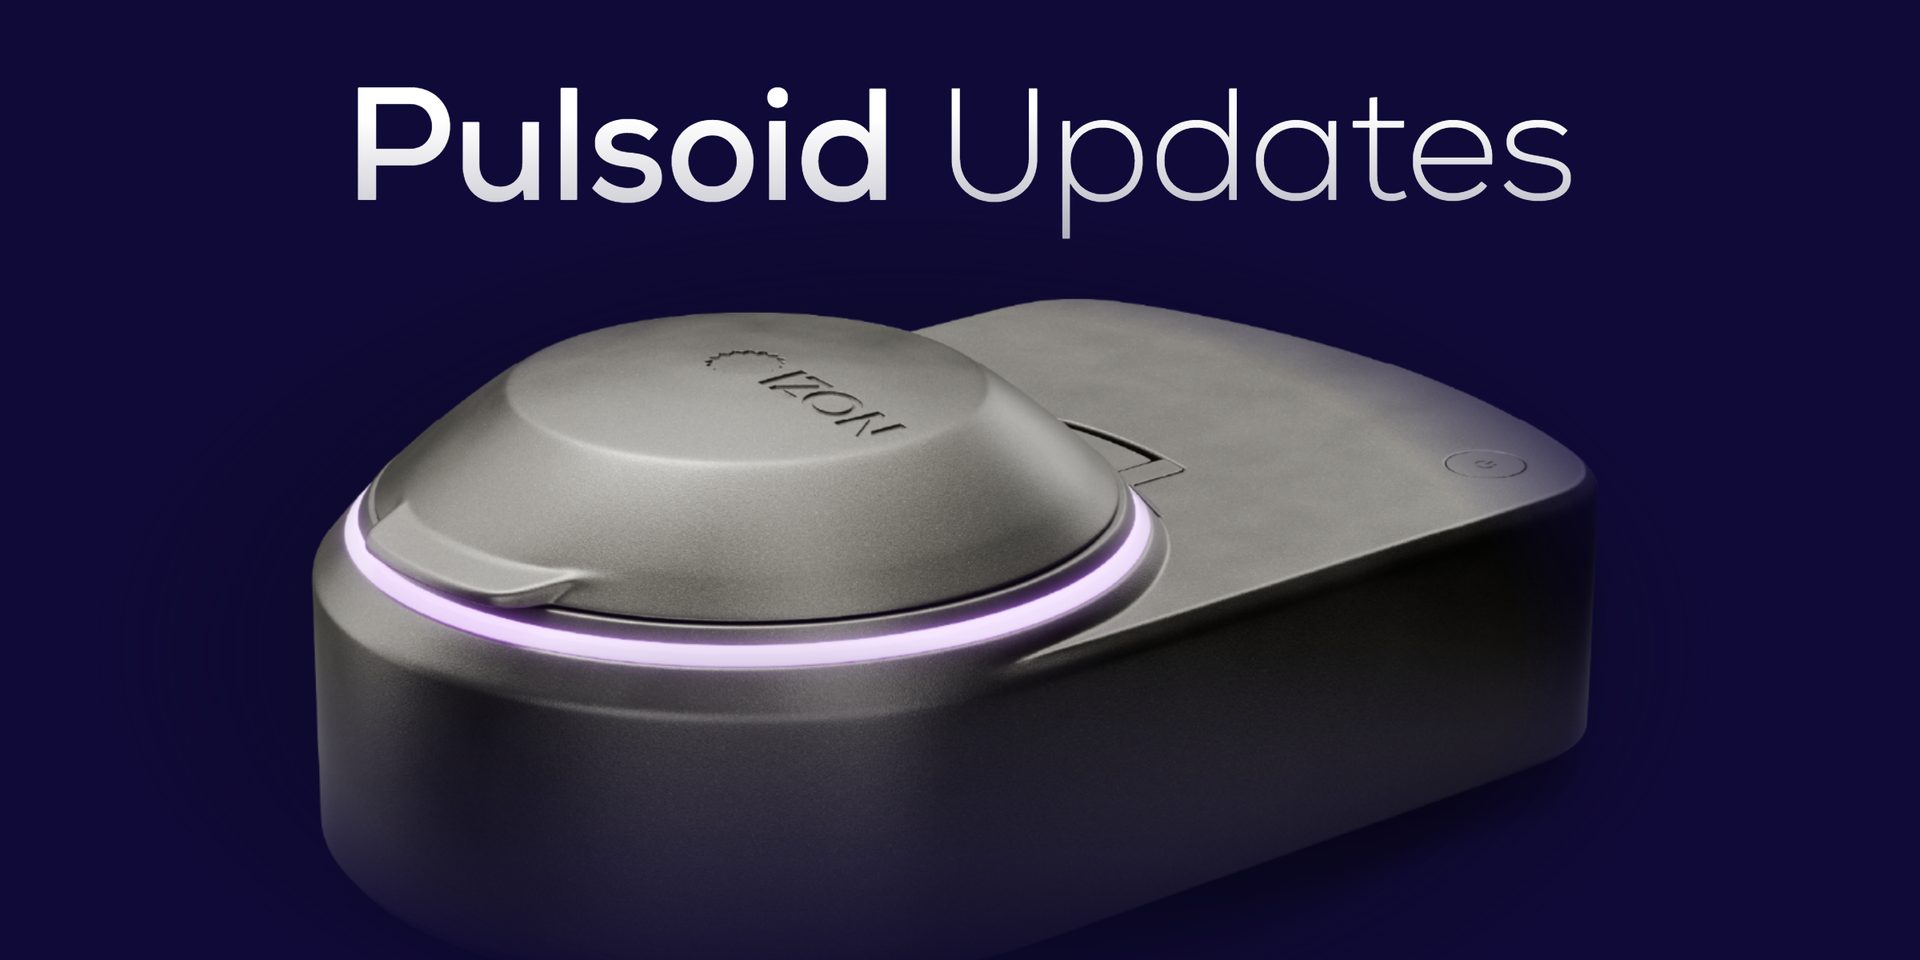
Characterise your LNPs particle by particle for formulation development, stability studies and batch-to-batch comparisons. Choose the instrument that fits your samples.
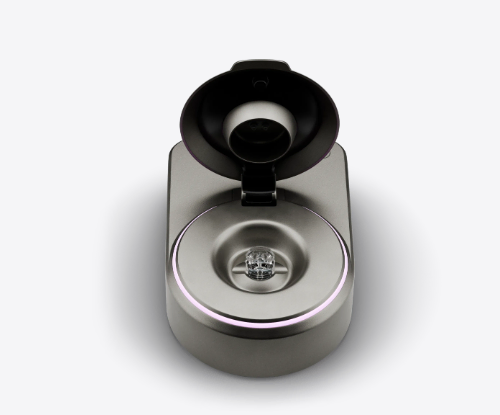
The Pulsoid